HTLTC-R: Color packages
palettes.RmdUsing this document
- Code blocks and R code have a grey background (note, code nested in the text is not highlighted in the pdf version of this document but is a different font).
- # indicates a comment, and anything after a comment will not be evaluated in R
- The comments beginning with ## under the code in the grey code boxes are the output from the code directly above; any comments added by us will start with a single #
- While you can copy and paste code into R, you will learn faster if you type out the commands yourself.
- Read through the document after class. This is meant to be a reference, and ideally, you should be able to understand every line of code. If there is something you do not understand please email us with questions or ask in the following class (you’re probably not the only one with the same question!).
RColorBrewer
The RColorBrewer package, based on work by Cynthia Brewer1, provides designed palettes of colors to use.
# If not available, the package can be installed using `install.packages`.
library(RColorBrewer)
Now, let’s display the RColorBrewer palettes:
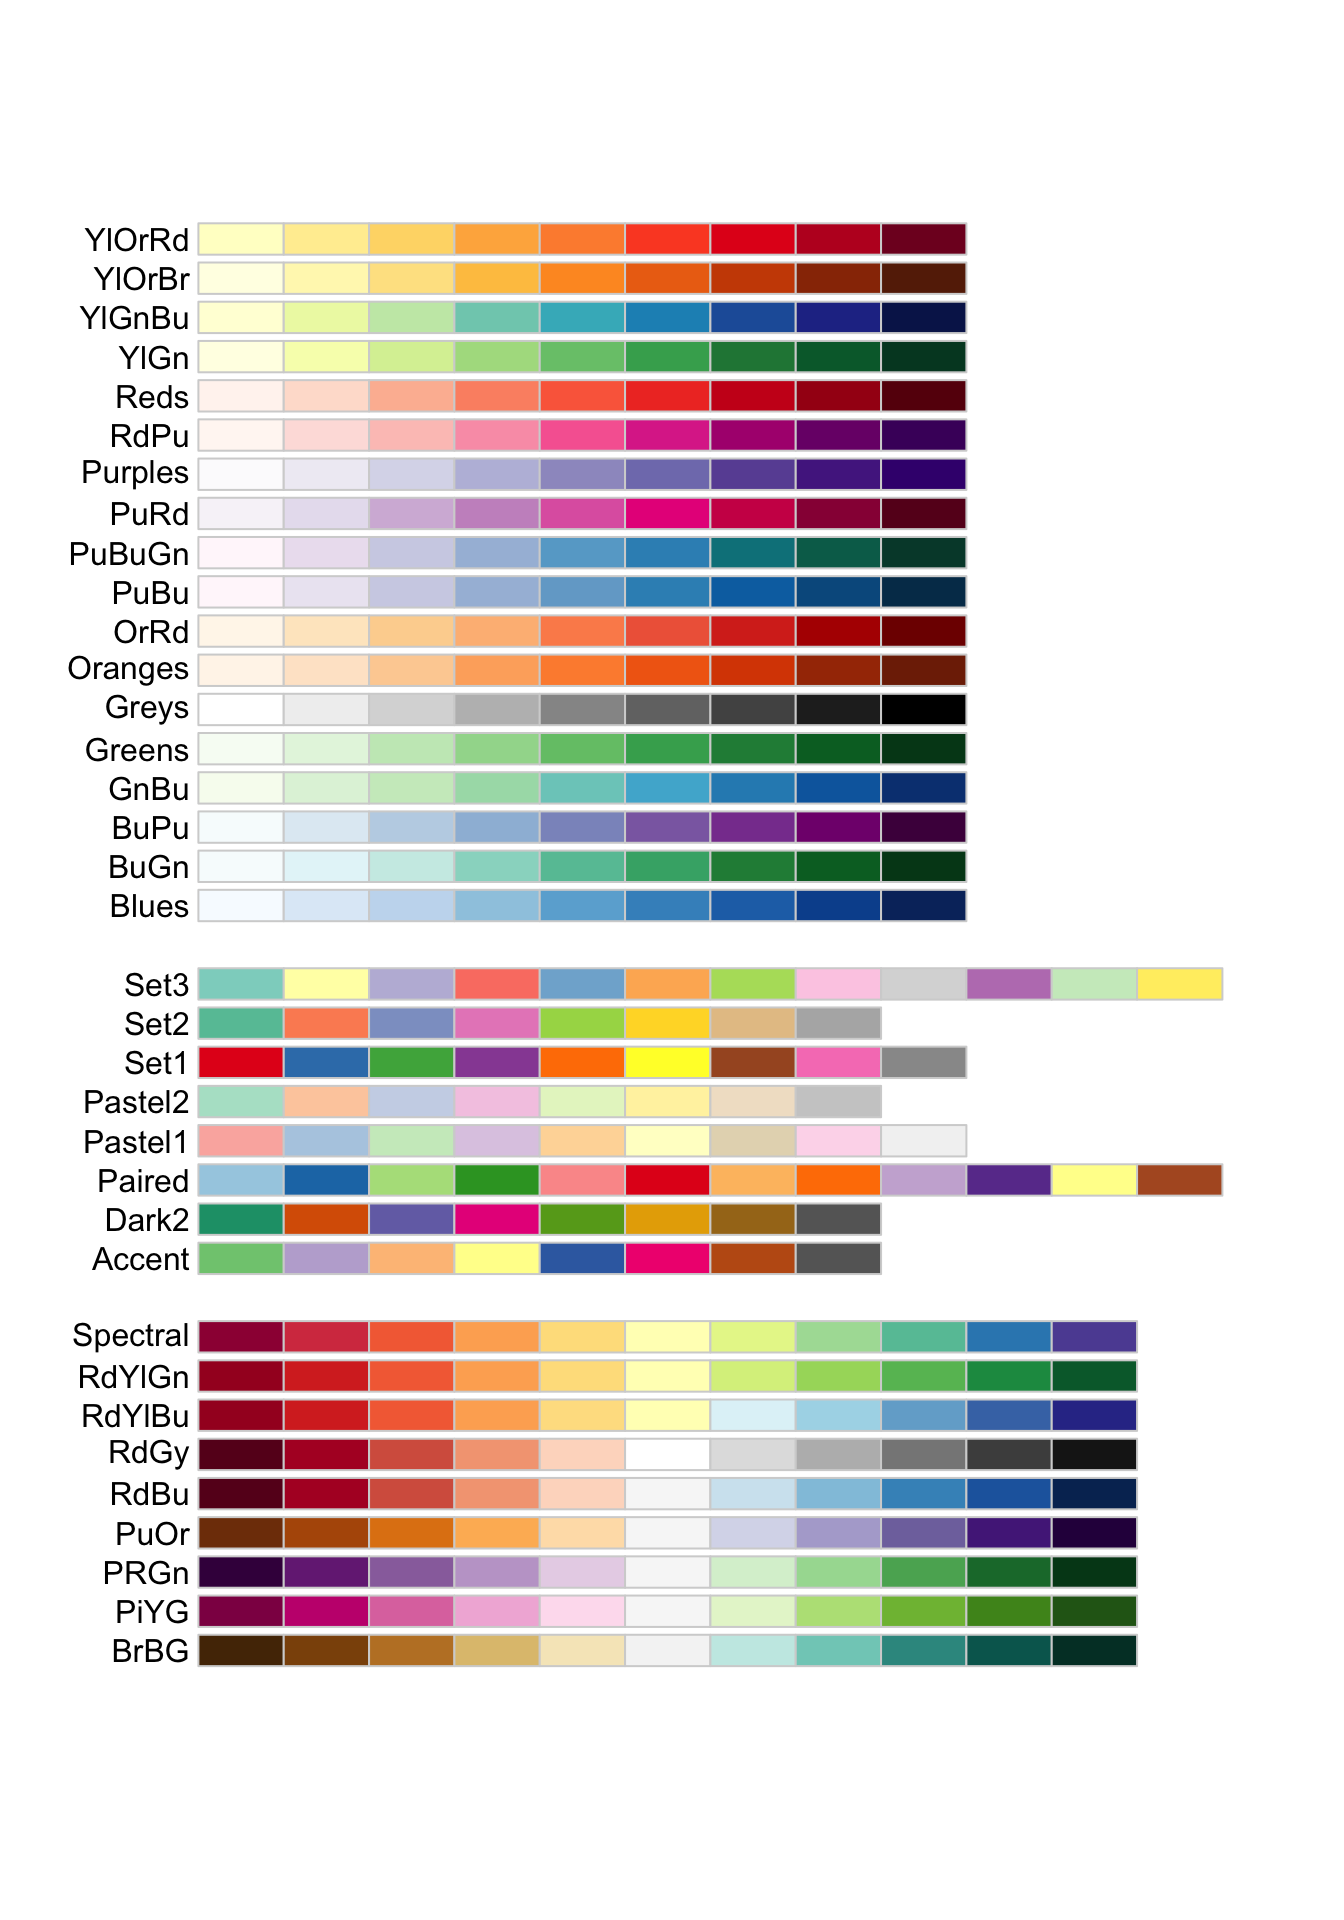
There are three main classes of palettes in RColorBrewer:
- Sequential:
- useful for showing numerical values from low-to-high, where one is interesting and the other is not, e.g. p-values, correlations
- typical application: heatmap
- Qualitative:
- equal perceptual weight/importance
- useful for showing categories, groups. Special case: “Paired” palette is good for non-experimental factors (e.g. cell lines, strains of mice), or binary experiment factors (e.g. Treated Vs Non-treated)
- typical application: bar plot
- Diverging:
- similar to Sequential palette
- useful for showing values ranging from extreme negative to extreme positive by going through neutral (non-extreme & non-interesting) values, e.g. z-scores, t-statistics
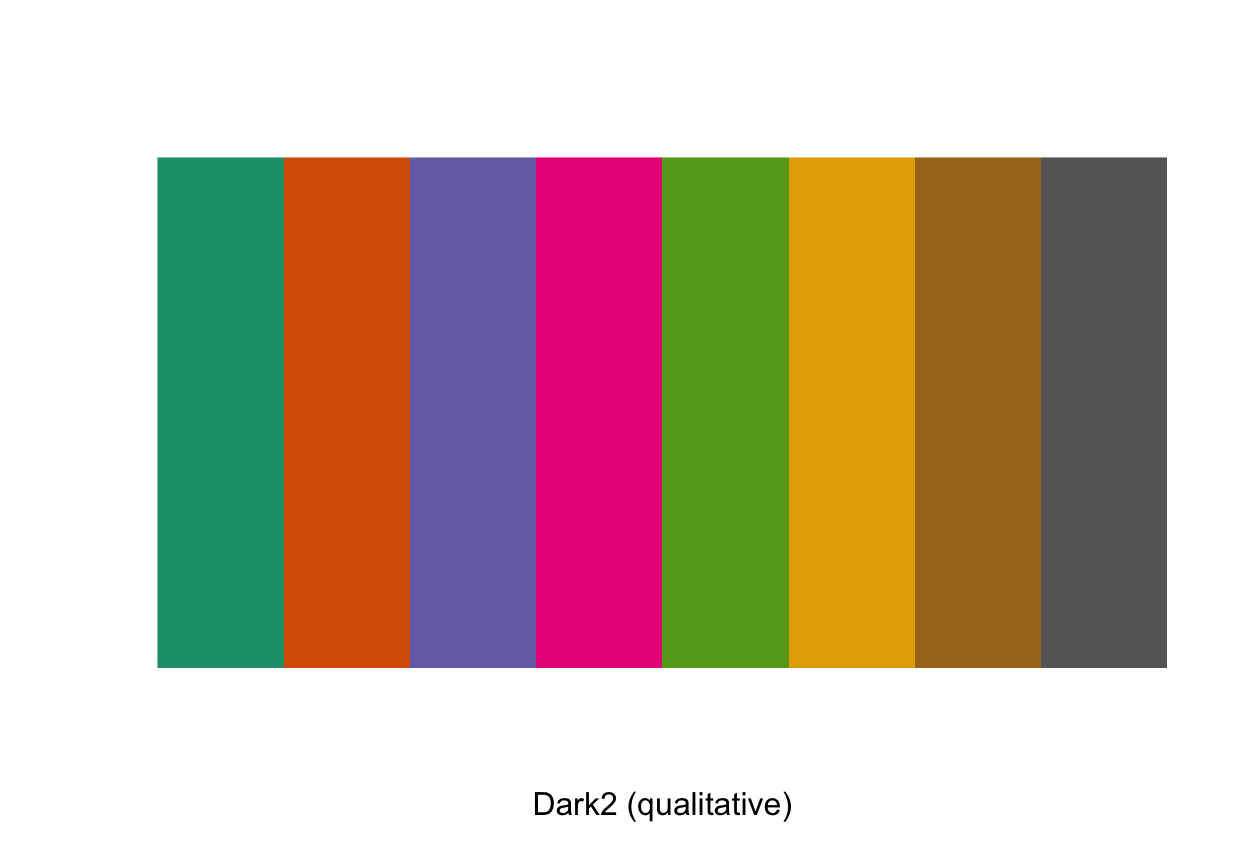
We can also see a single RColorBrewer palette by defining the name and size of the palette using the brewer.pal(). For example, the following code selects “Dark2” palette that contains eight colors.
display.brewer.pal(n = 8, name = 'Dark2')
colorspace
Another package to generate the sets of colors is the colorspace package2, which creates colors in a number of color spaces as well as functions to convert between color spaces. By contrast, the palettes in RColorBrewer are fixed.
The three dimensions of the HCL color model:
Hue: “color or shade”. \(H \in [0,360]\)
Chroma: “colorfulness, or intensity of color as compared to gray”. \(C \in [0,100]\)
Luminance: “brightness”, or amount of gray. \(L \in [0,100]\)
library(colorspace)
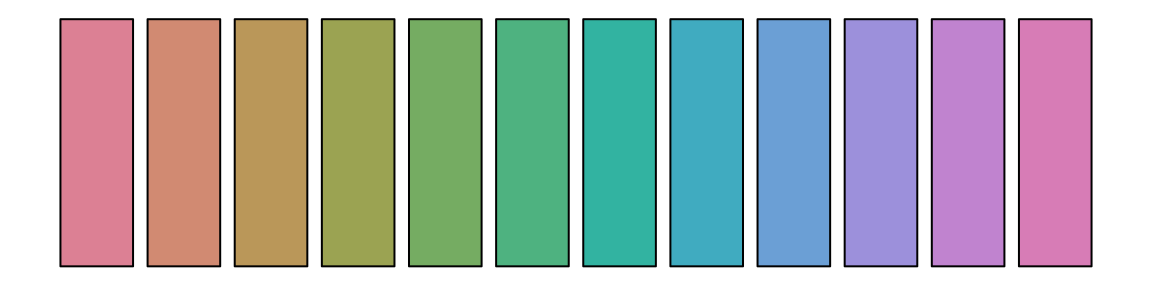
The rainbow_hcl() function provides a qualitative palette that is good for coding a categorical variable:
palette(rainbow_hcl(12))
par(mar = rep(0.5, 4))
barplot(rep(1, 12), col = 1:12, ann = FALSE, axes = FALSE)
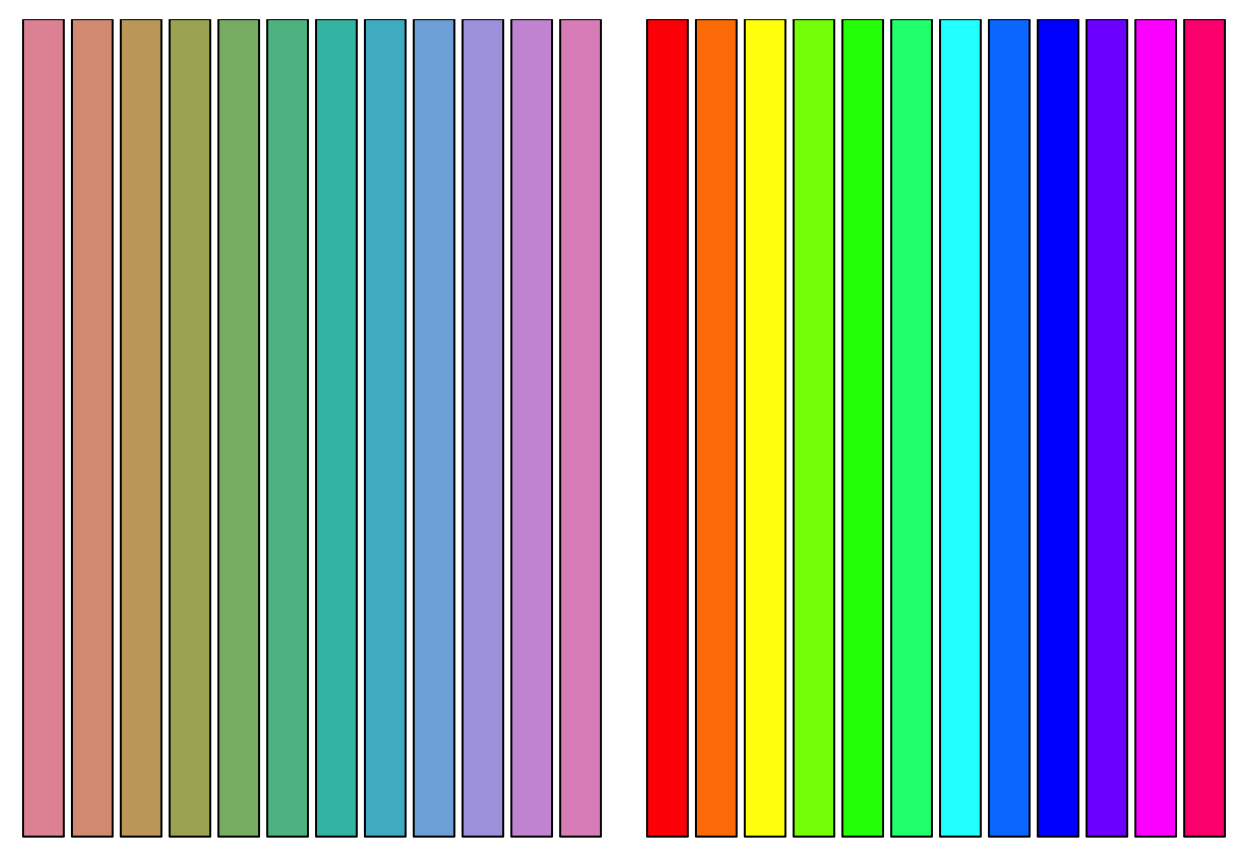
# Compare base and colorspace palettes
par(mfrow = c(1, 2), mar = rep(0, 4), oma = c(0.5, 0, 0.5, 0))
barplot(rep(1, 12), col = rainbow_hcl(12), ann = FALSE, axes = FALSE)
barplot(rep(1, 12), col = rainbow(12),     ann = FALSE, axes = FALSE)
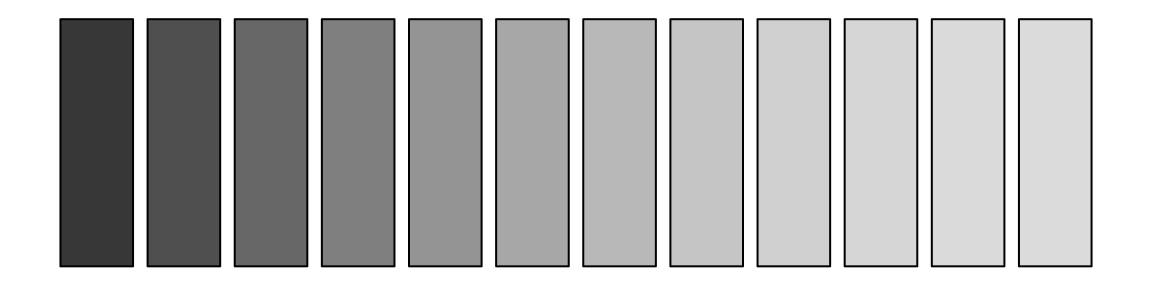
The sequential_hcl() function provides a sequential palette that is good for coding numerical information that ranges in a certain interval (low values are considered to be uninteresting and high values are interesting). Below is an example of sequential palette that only varies luminance.
palette(sequential_hcl(12, c = 0, power = 2.2))
par(mar = rep(0.5, 4))
barplot(rep(1, 12), col = 1:12, ann = FALSE, axes = FALSE)
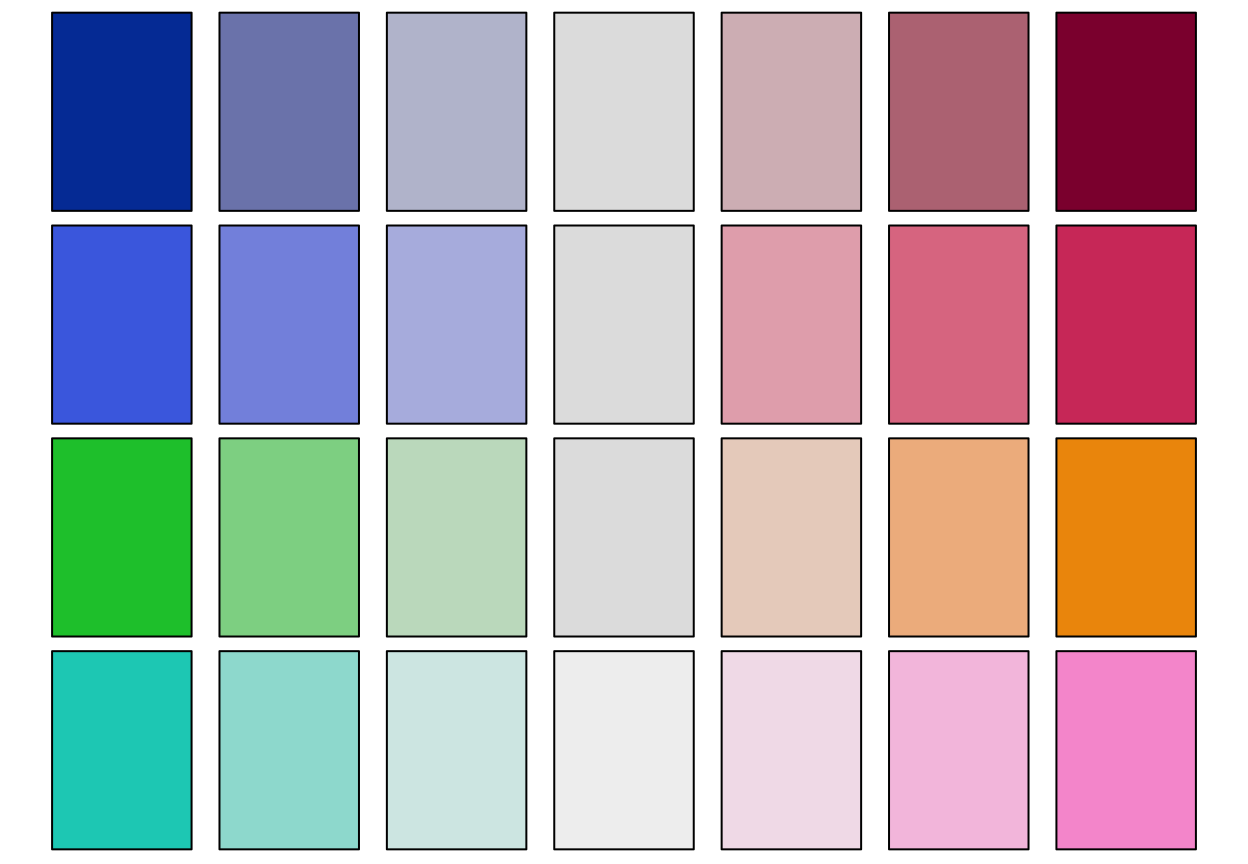
The diverge_hcl() function provides a diverging palette that is also good for coding numerical information that ranges in a certain interval but with a neutral value. Below are examples for several diverging palettes that have different pairs of hues and decreasing luminance contrasts:
par(mar = rep(0.25, 4), mfrow = c(4, 1), oma = c(0.25, 0, 0.25, 0))
# diverging red-blue colors
palette(diverge_hcl(7))
barplot(rep(1, 7), col = 1:7, ann = FALSE, axes = FALSE)
palette(diverge_hcl(7, c = 100, l = c(50, 90), power = 1))
barplot(rep(1, 7), col = 1:7, ann = FALSE, axes = FALSE)
palette(diverge_hcl(7, h = c(130, 43), c = 100, l = c(70, 90)))
barplot(rep(1, 7), col = 1:7, ann = FALSE, axes = FALSE)
# diverging cyan-magenta colors
palette(diverge_hcl(7, h = c(180, 330), c = 59, l = c(75, 95)))
barplot(rep(1, 7), col = 1:7, ann = FALSE, axes = FALSE)
Achim Zeileis, Kurt Hornik, Paul Murrell (2009). Escaping RGBland: Selecting Colors for Statistical Graphics. Computational Statistics & Data Analysis, 53(9), 3259-3270. doi:10.1016/j.csda.2008.11.033↩︎